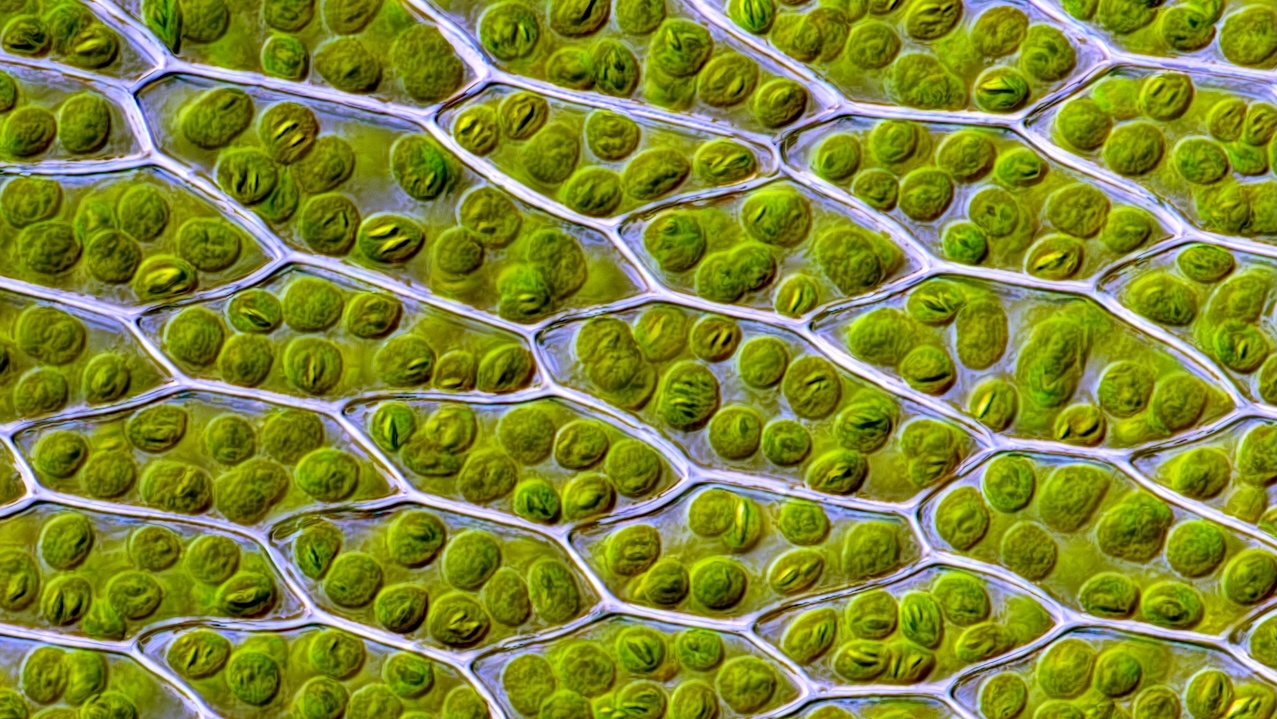
Live leaf cells of the moss Bryum capillare, showing abundant chloroplasts (green spherical bodies) and their accumulated starch granules (elongated bodies within chloroplasts). CC BY-SA 4.0 Wikipedia Research led by

Live leaf cells of the moss Bryum capillare, showing abundant chloroplasts (green spherical bodies) and their accumulated starch granules (elongated bodies within chloroplasts). CC BY-SA 4.0 Wikipedia Research led by

The sulfur compounds give the “yellow vent” at Kueishantao, Taiwan, its characteristic yellow color. Prof. Li-Lian Liu and her research group, Department of Oceanography, National Sun Yat-sen University, Kaohsiung, Taiwan

Snowball Earth — Grok via Astrobiology.com A new study led by researchers at the Earth-Life Science Institute (ELSI) at Institute of Science Tokyo challenges a long-standing assumption about Earth’s most

The boulder-covered moon Dimorphos as seen 8.55 seconds before the impact of the DART space craft. The same image after correcting for lighting conditions across the surface and
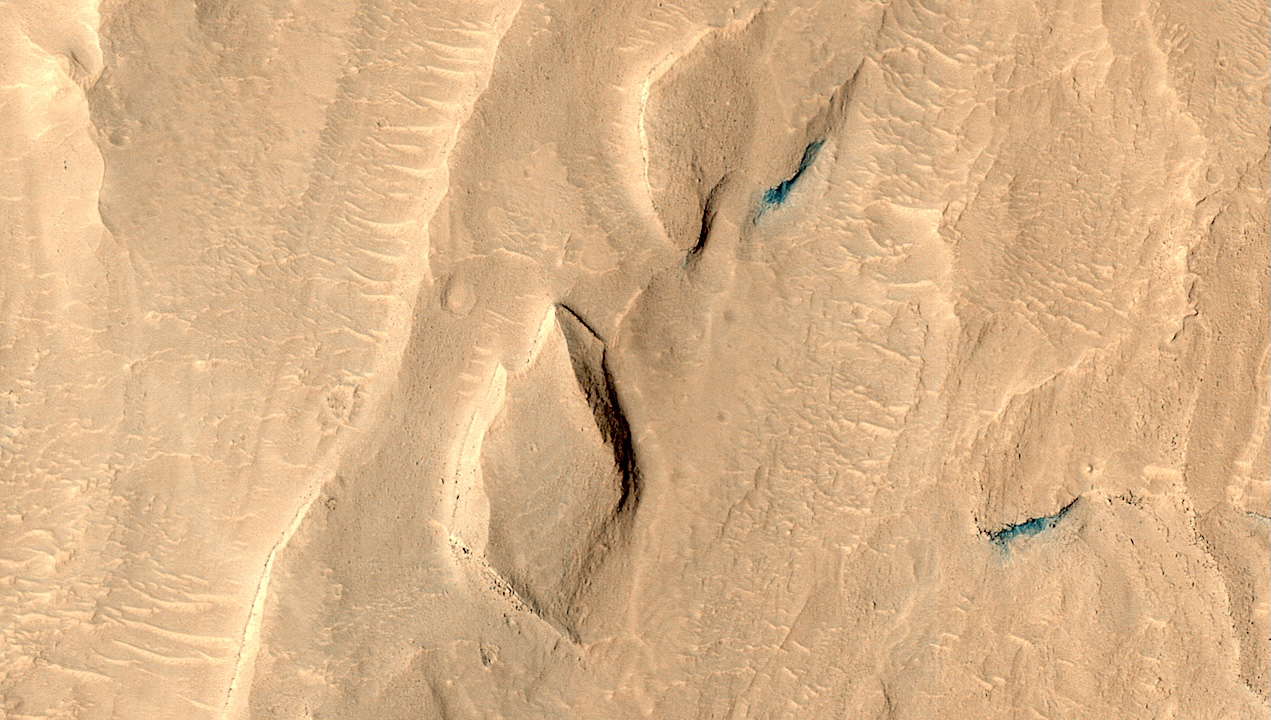
ID: ESP_076745_1750,date: 10 December 2022, altitude: 268 km larger image NASA/JPL-Caltech/University of Arizona This observation features an upper section of a canyon channel system that incising Mount Sharp in Gale

ExoMiner++ Everyone is invited to the monthly artificial intelligence and machine learning virtual seminar hosted by the Exobiology Branch at the NASA Ames Research Center. Previously recorded seminars can be
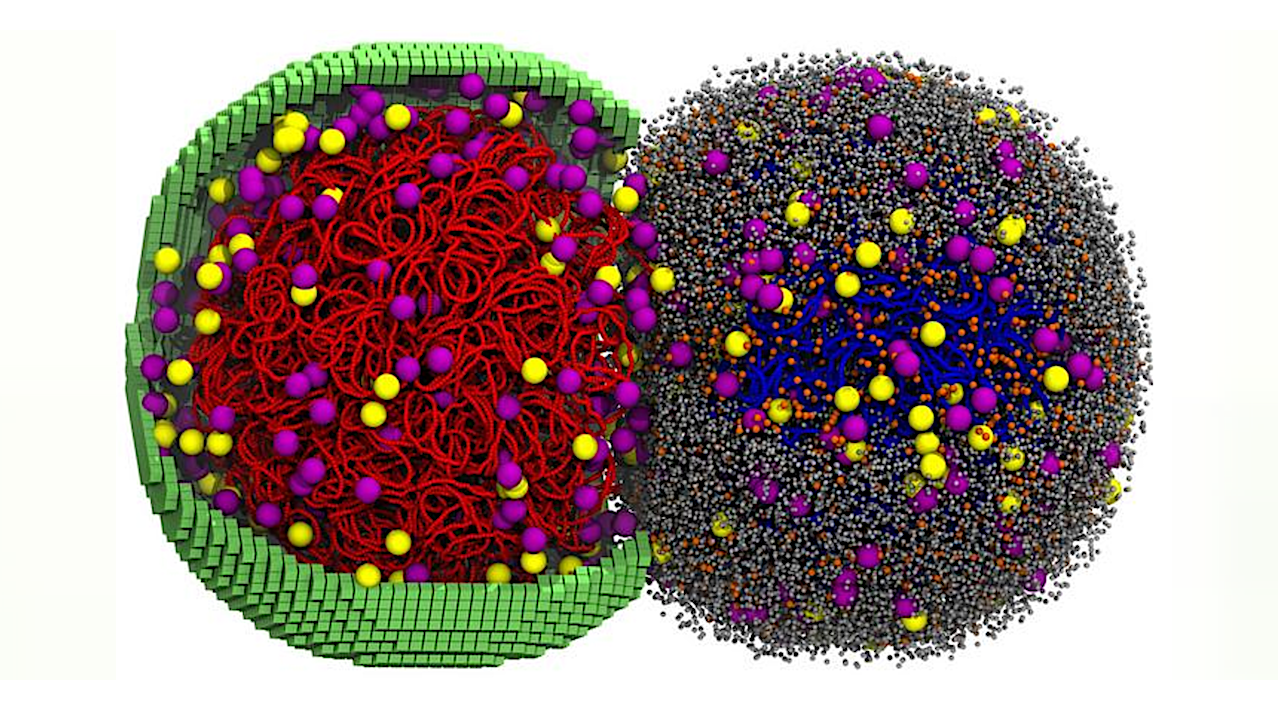
A simulated cell in the early stages of division. Left half shows membrane (green cubes), and ribosomes (yellow/purple) interwoven through in the cell’s chromosome (red). Right side shows all the
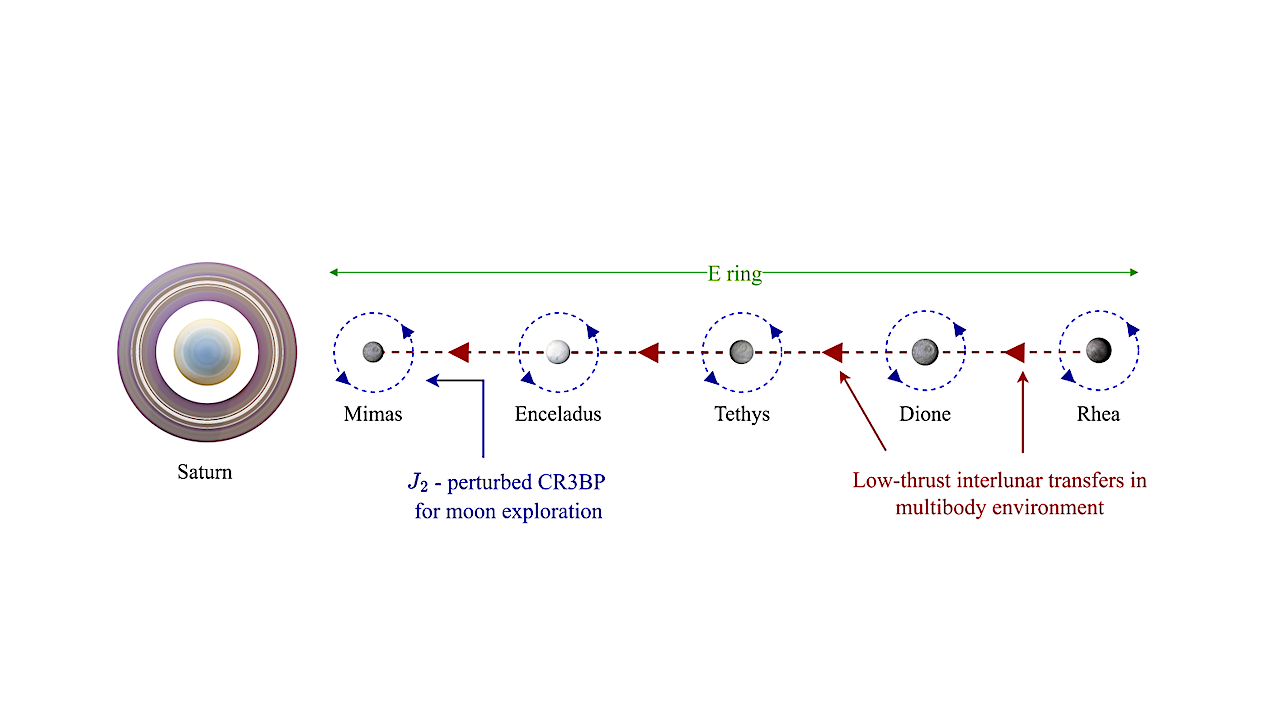
Sketch of the MT strategy, highlighting the dynamical models used in the distinct phases of the tour. — math.DS This study presents the trajectory design for a mission touring Saturn’s
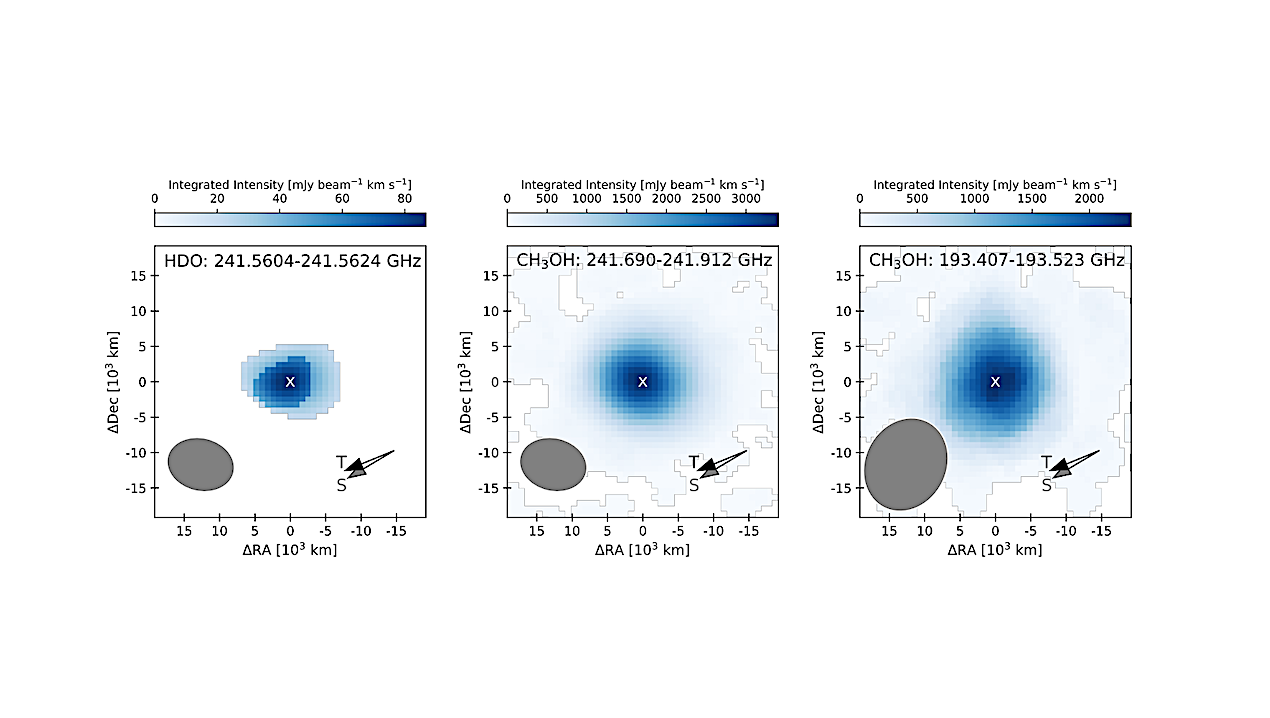
Integrated intensity (moment 0) maps of the detected species. From left to right, HDO, CH3OH in Band 6 and CH3OH in Band 5. For each image, the ellipse in the
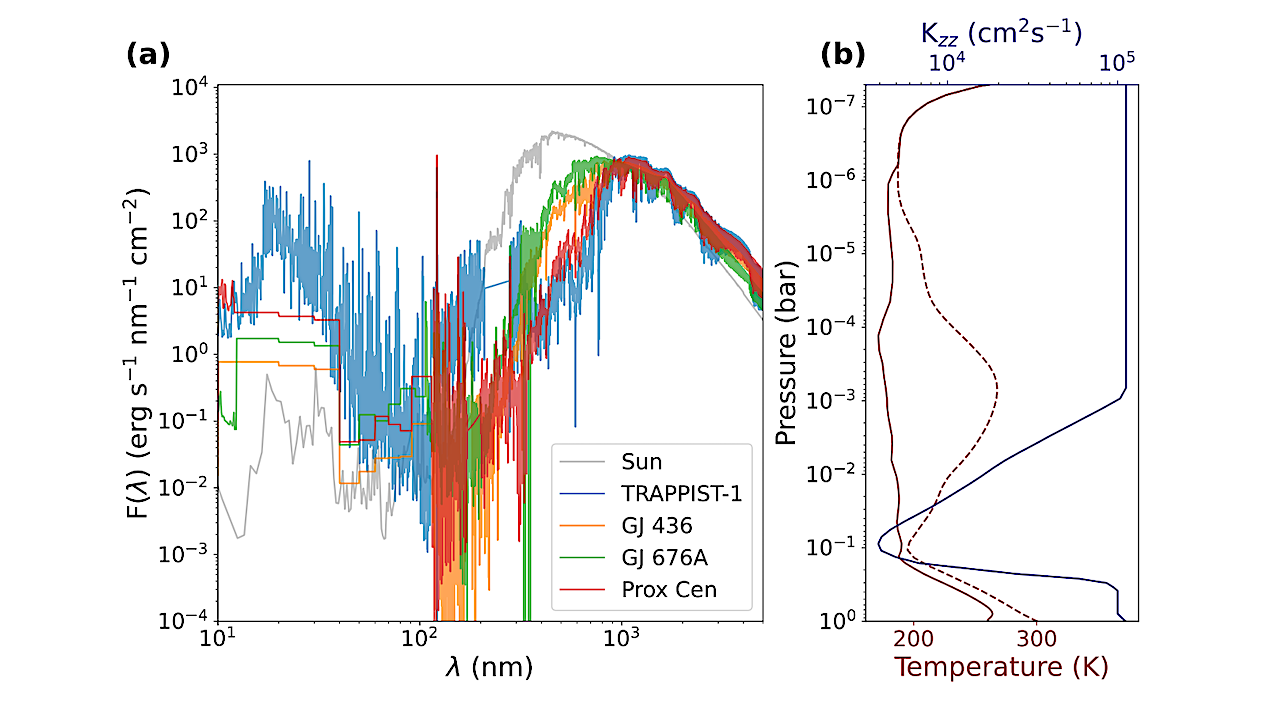
Background stellar and planetary environments: (a) the spectral radiant flux density as received by Proxima Centauri b and planets around different M-type stars receiving the same irradiance, compared to the