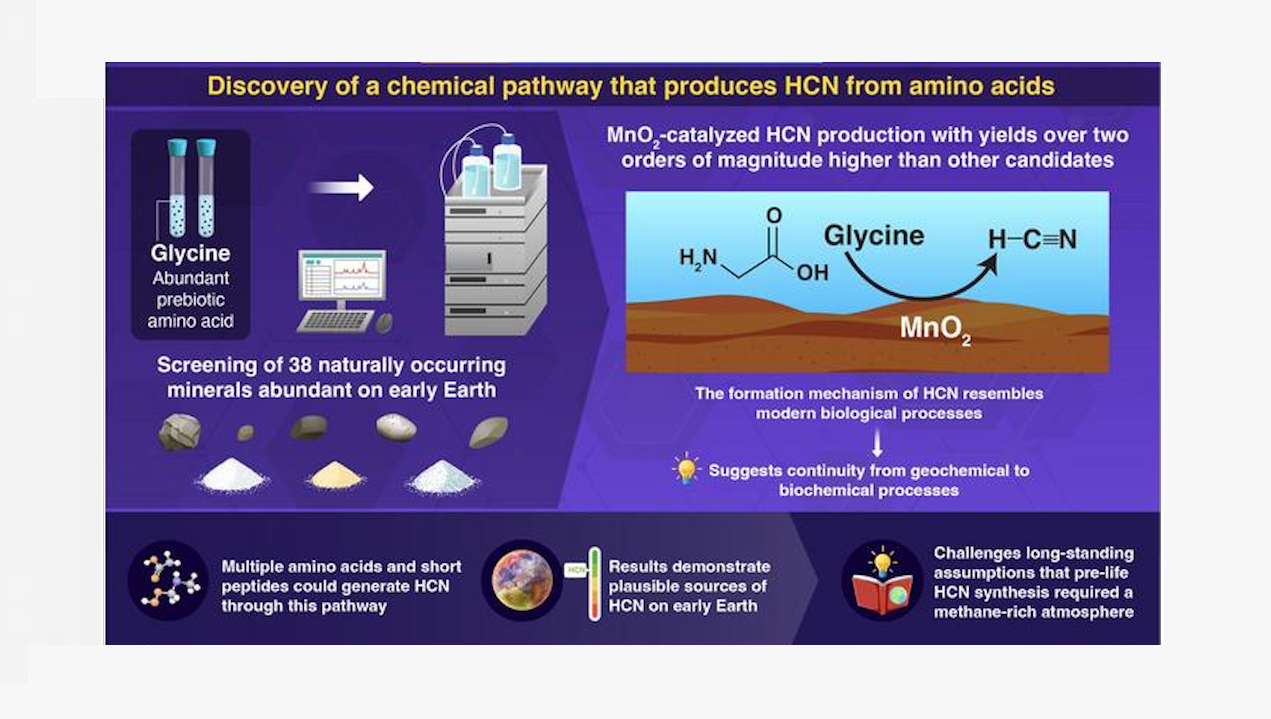
This study identified a chemical pathway promoted by naturally occurring minerals that explains how hydrogen cyanide might have formed on early Earth. Credit Institute of Science Tokyo Manganese dioxide can

This study identified a chemical pathway promoted by naturally occurring minerals that explains how hydrogen cyanide might have formed on early Earth. Credit Institute of Science Tokyo Manganese dioxide can
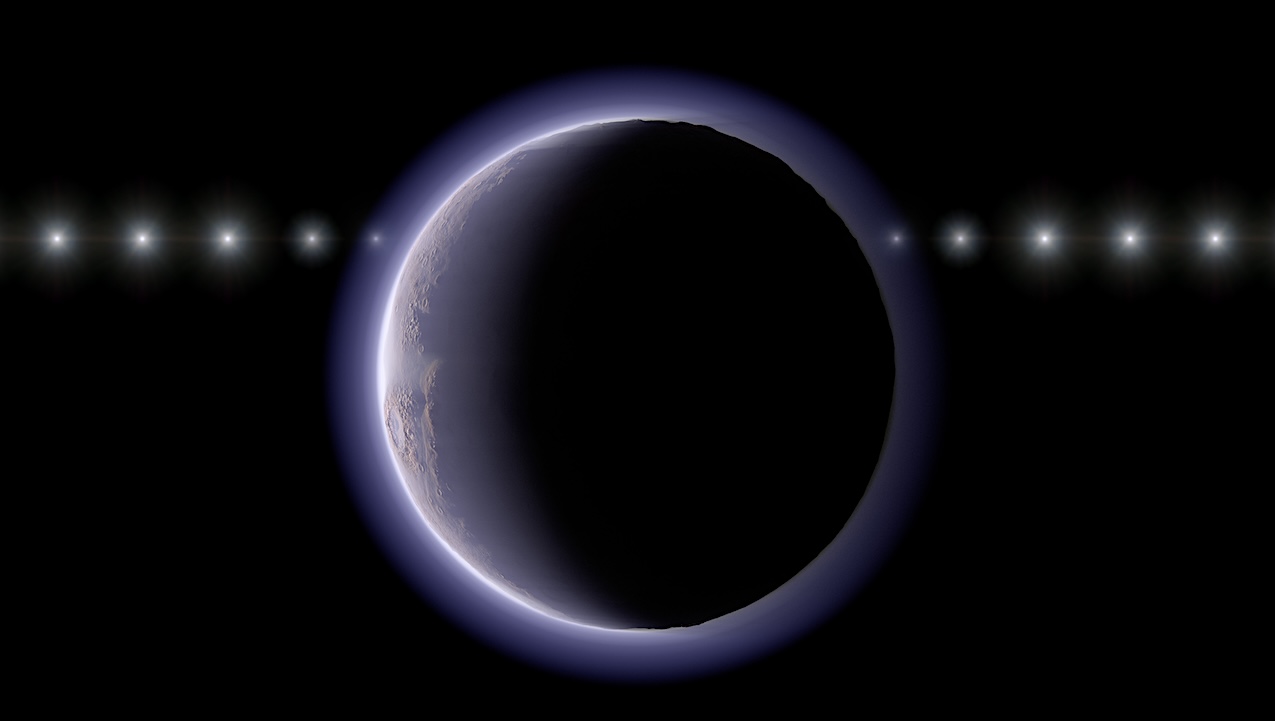
Artist’s conception of this research showing an imagined time sequence as a star passes behind a TNO with an atmosphere. (Credit: NAOJ) A team of professional and amateur Japanese astronomers
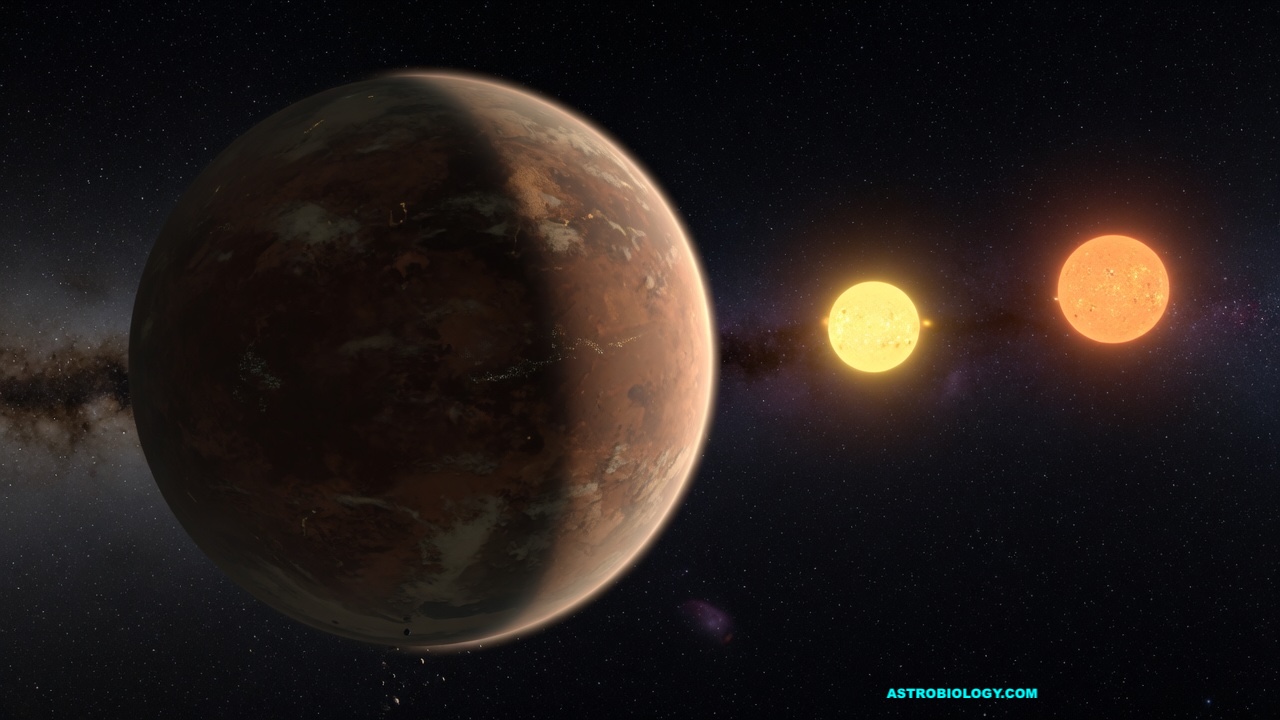
Circumbinary planet — Grok via Astrobiology.com There’s so little we know about circumbinary planets – planets that orbit two stars instead of one – that they can feel like the
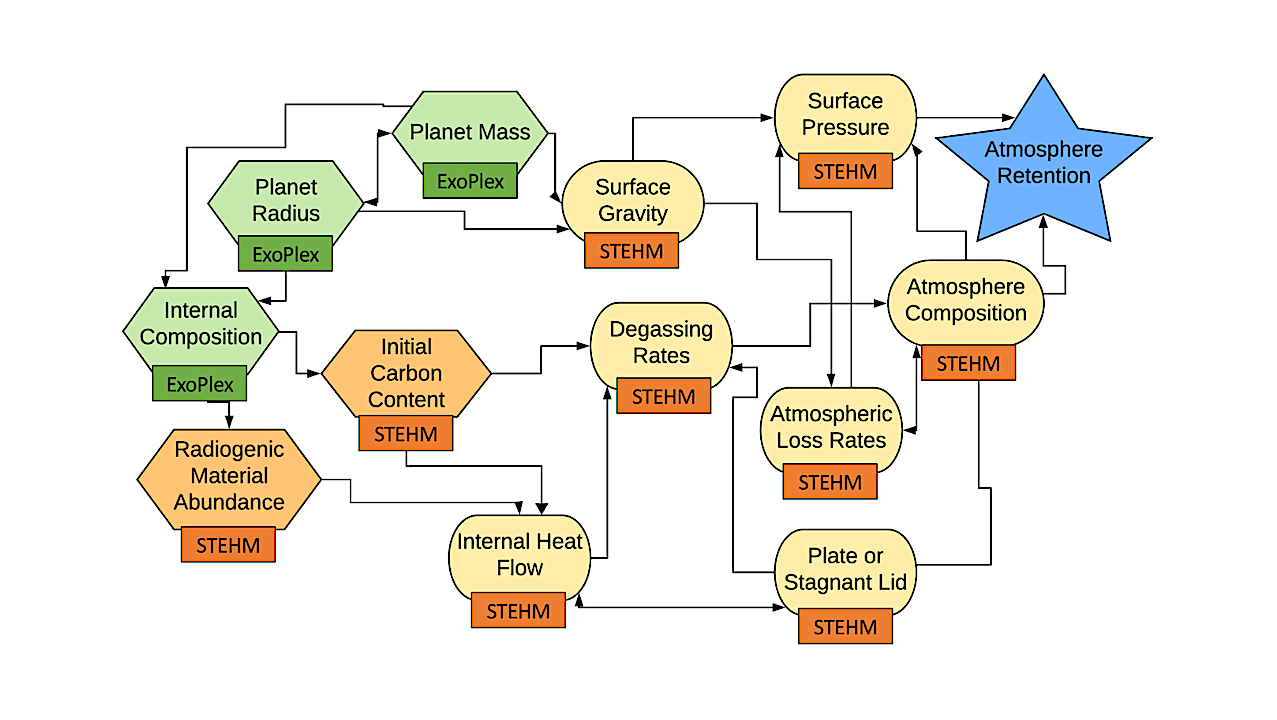
STEHM flow chart. Green hexagons are input parameters that are calculated by ExoPlex. Orange hexagons are input parameters set within STEHM. Yellow stadiums are components that are explored by STEHM.
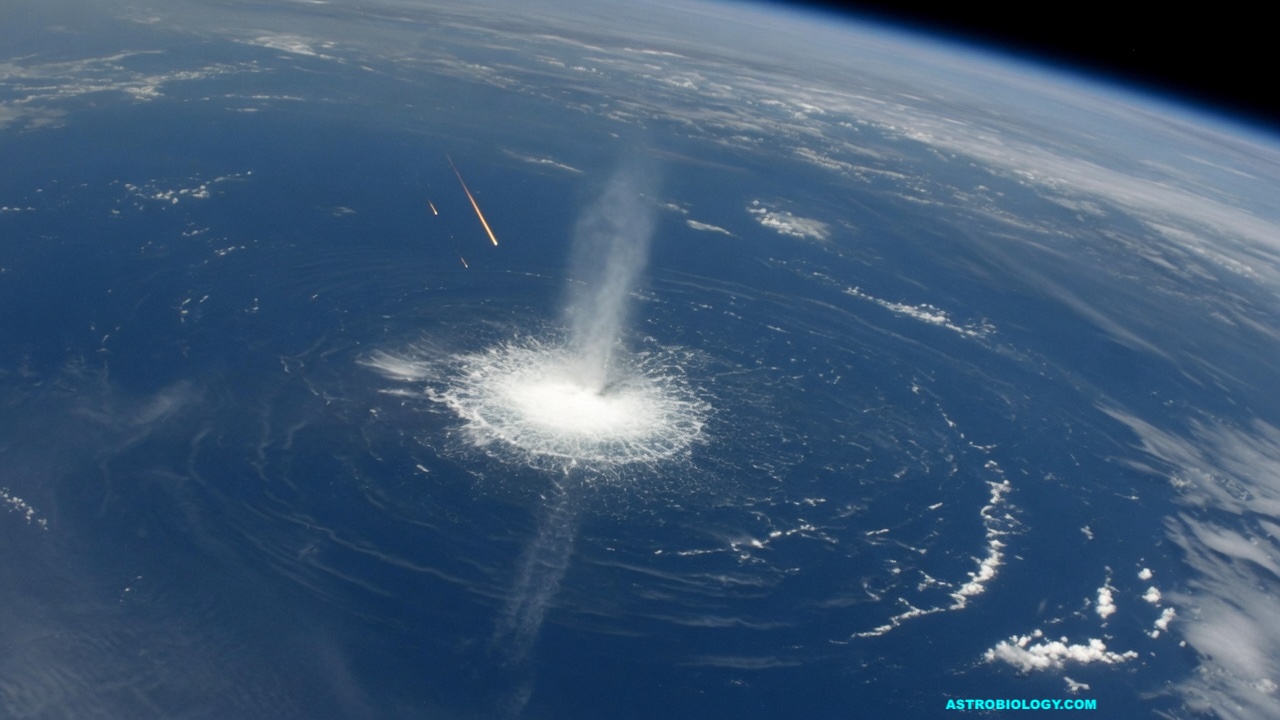
An Impactor Strikes Earth’s Global Ocean — Grok via Astrobiology.com A long-standing idea in planetary science is that water-rich meteorites arriving late in Earth’s history could have delivered a major
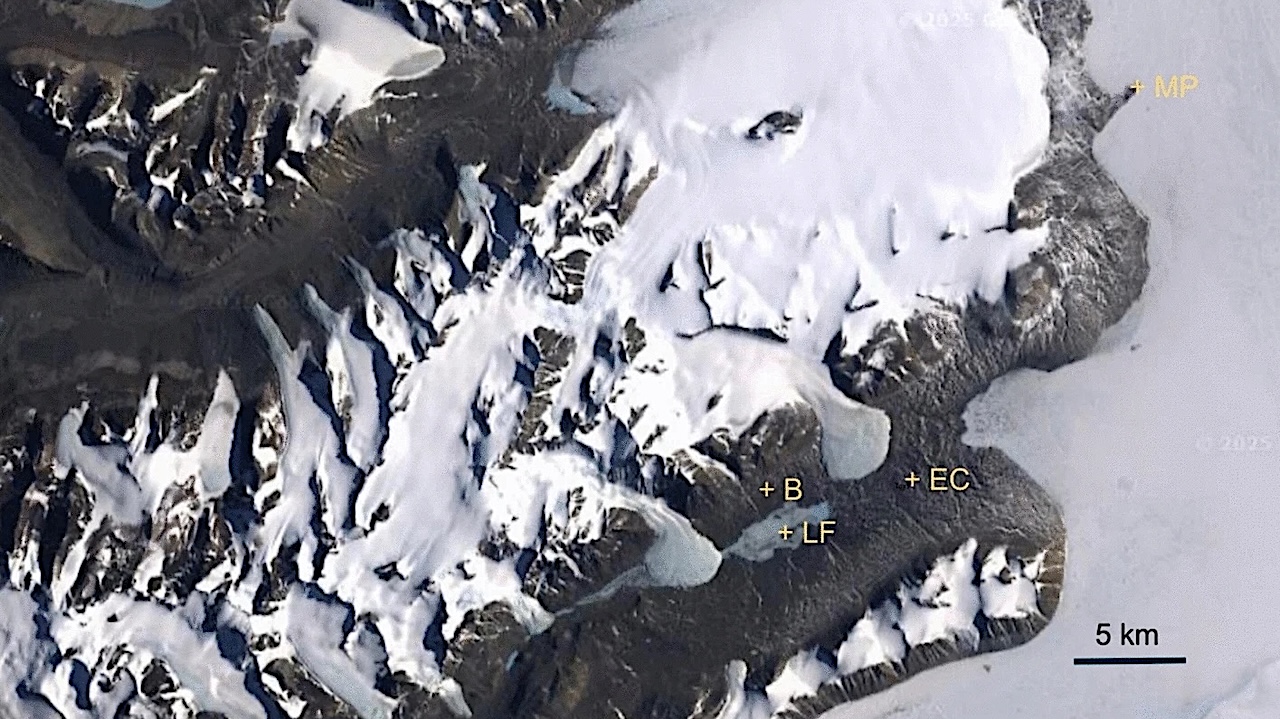
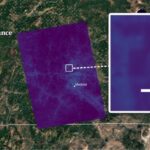
Location of all three MET stations, Lake Fryxell (LF), Explorer Cove (EC) and Marble Point (MP). The site investigated by Büdel et al. (2008) is marked as B. Note the
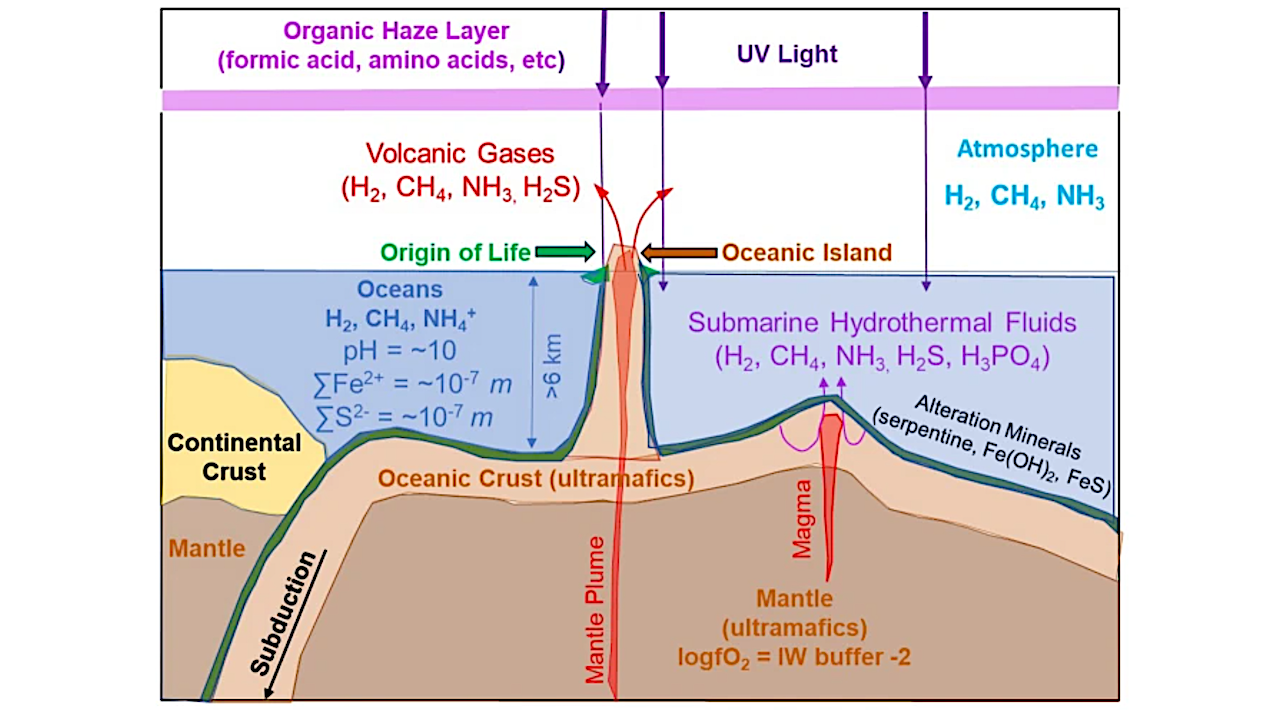
A schematic illustration of the geological and geochemical characteristics of the pre-biotic Earth. The important characteristics include: the nearly-completely ocean-covered Earth; the continental crust mostly submerged in the oceans; the
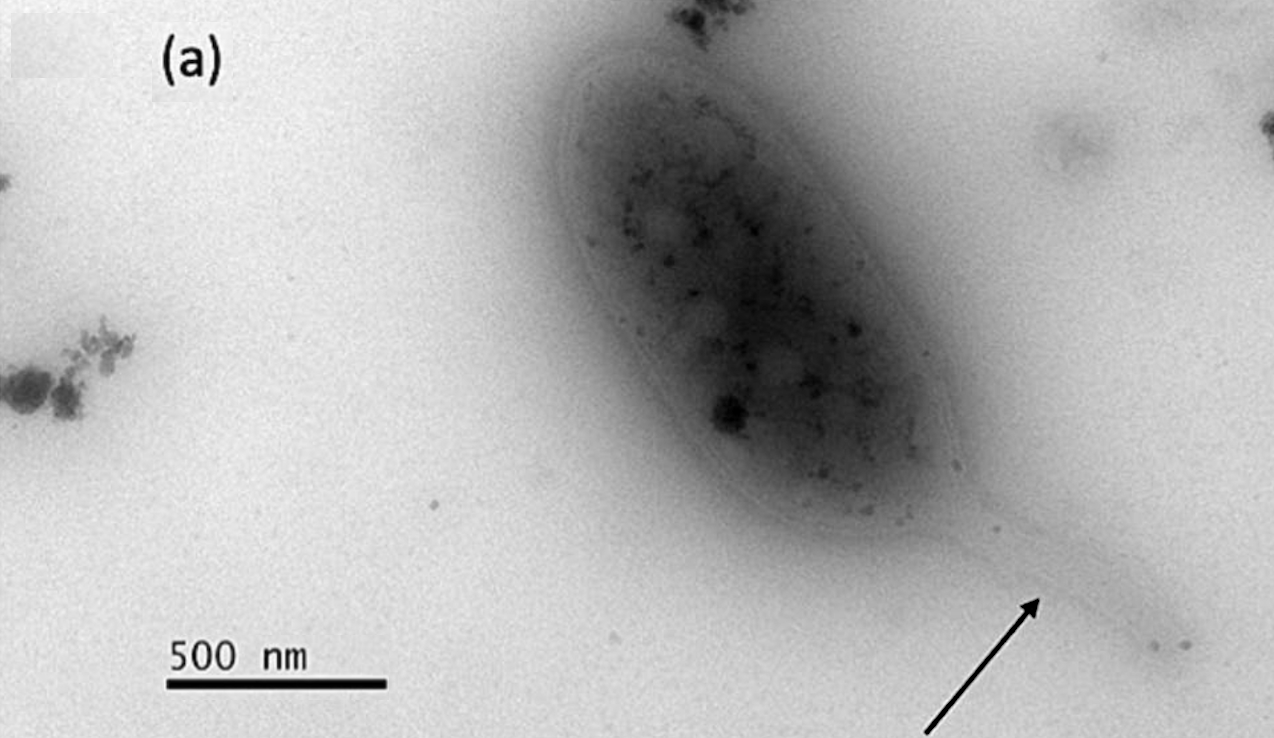
Transmission electron microscopy microphotographs of cells of strain HK31-GT grown on R2A at 25 °C for 3 days. (a) Some cells harbor a cellular appendage, so-called prostheca or stalk (indicated
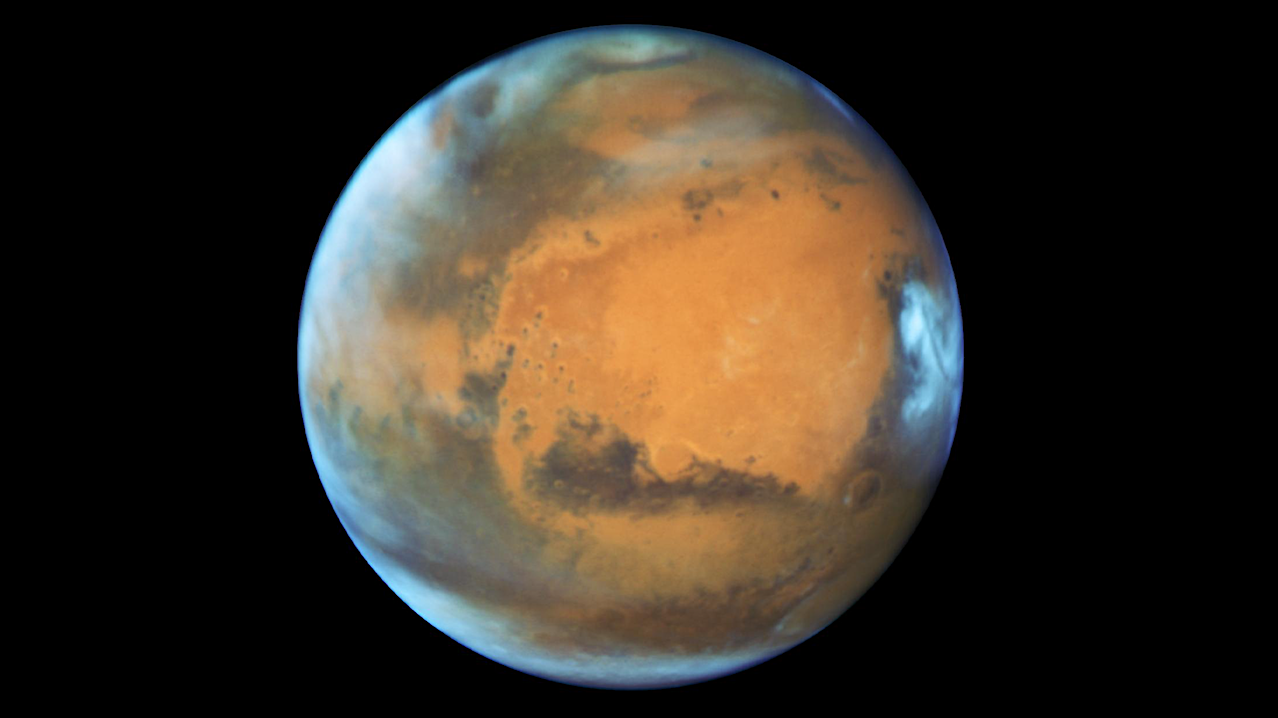
Volcanic eruptions and glacial ice have occurred at virtually all latitudes and altitudes throughout Mars history. To assess the astrobiological potential of processes and microenvironments associated with lava flows onto
EAI Seminar: Testing A Rock-RNA World To Create Early Life by Dieter Braun, LMU Munich, May 5th 2026, 16:00 CEST (UTC + 02:00) Abstract: We are pursuing lab