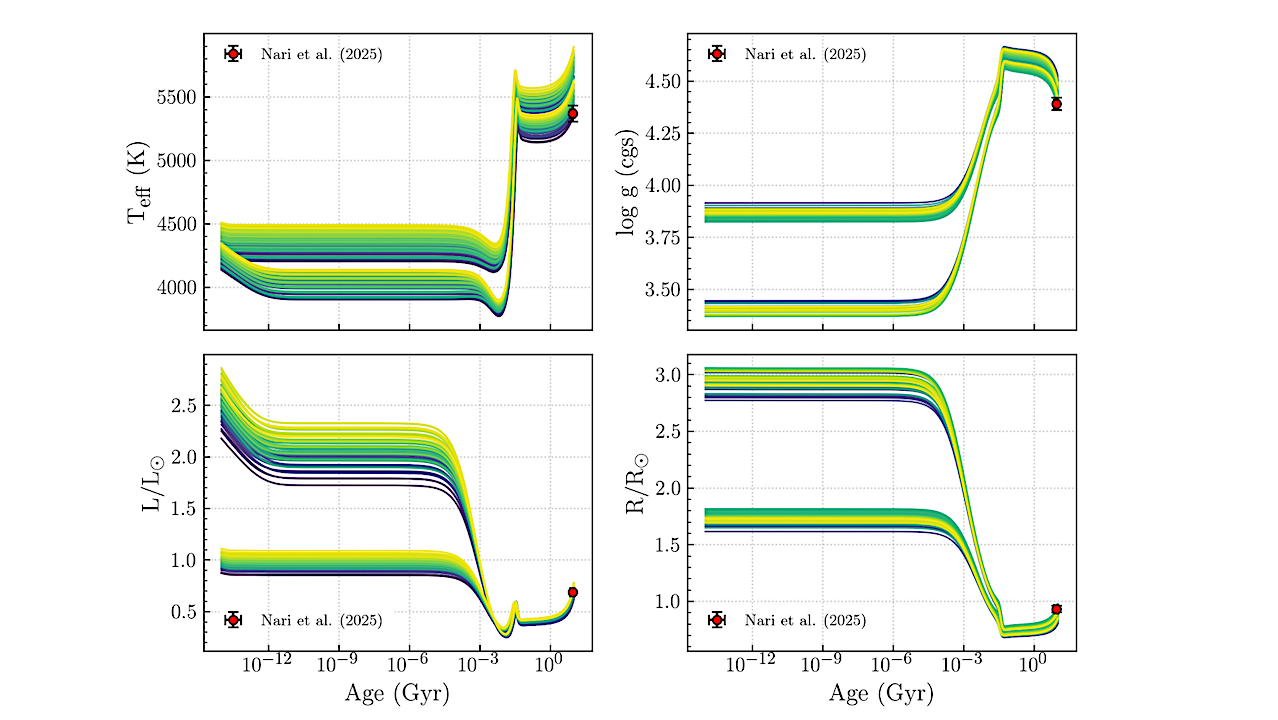
Evolutionary tracks of HD 20794 computed with MESA, showing the time evolution of effective temperature (Teff), surface gravity (log g), luminosity (L/L⊙), and radius (R/R⊙) as a function of stellar

Evolutionary tracks of HD 20794 computed with MESA, showing the time evolution of effective temperature (Teff), surface gravity (log g), luminosity (L/L⊙), and radius (R/R⊙) as a function of stellar
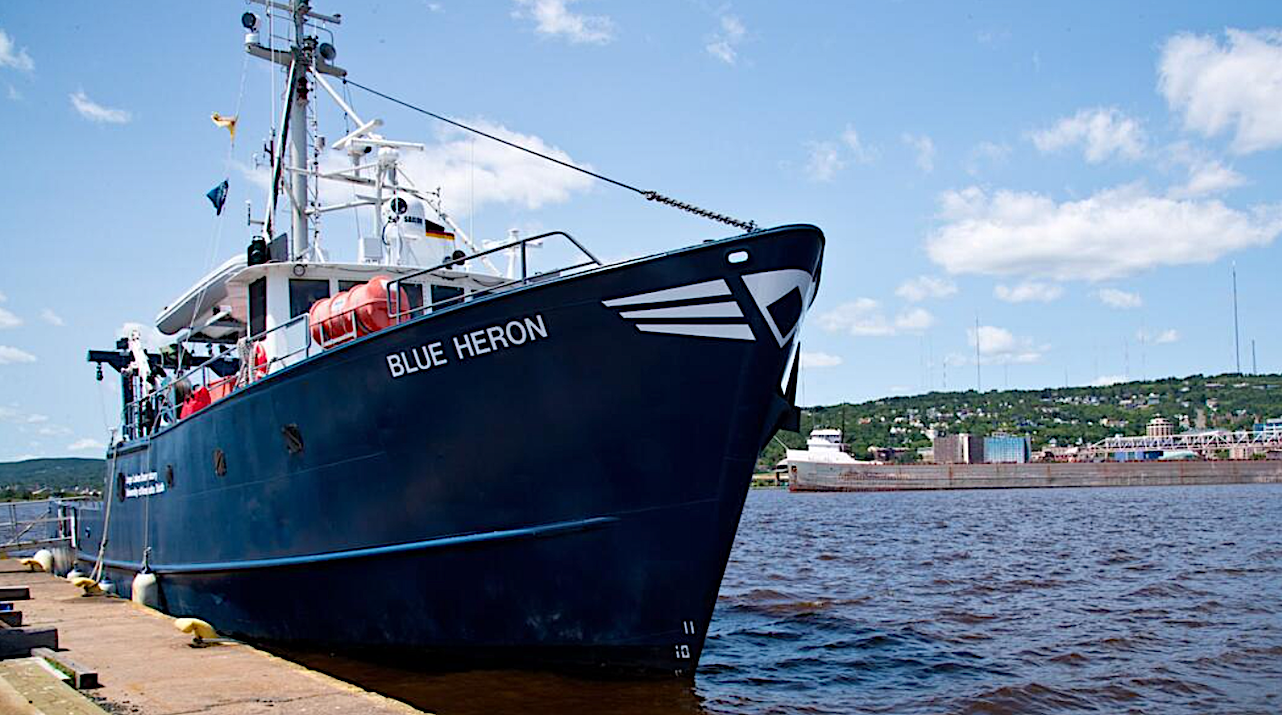
R/V Blue Heron — University of Minnesota Duluth Routine maintenance leads to unexpected microbial discovery in “ship goo” on the R/V Blue Heron’s rudder shaft. When Large Lakes Observatory (LLO)

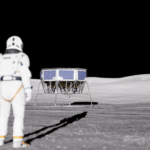
The abstract in PubMed or at the publisher’s site is linked when available and will open in a new window. Monfared V, Iwaniec UT, Turner RT.Spaceflight and the rodent skeleton:
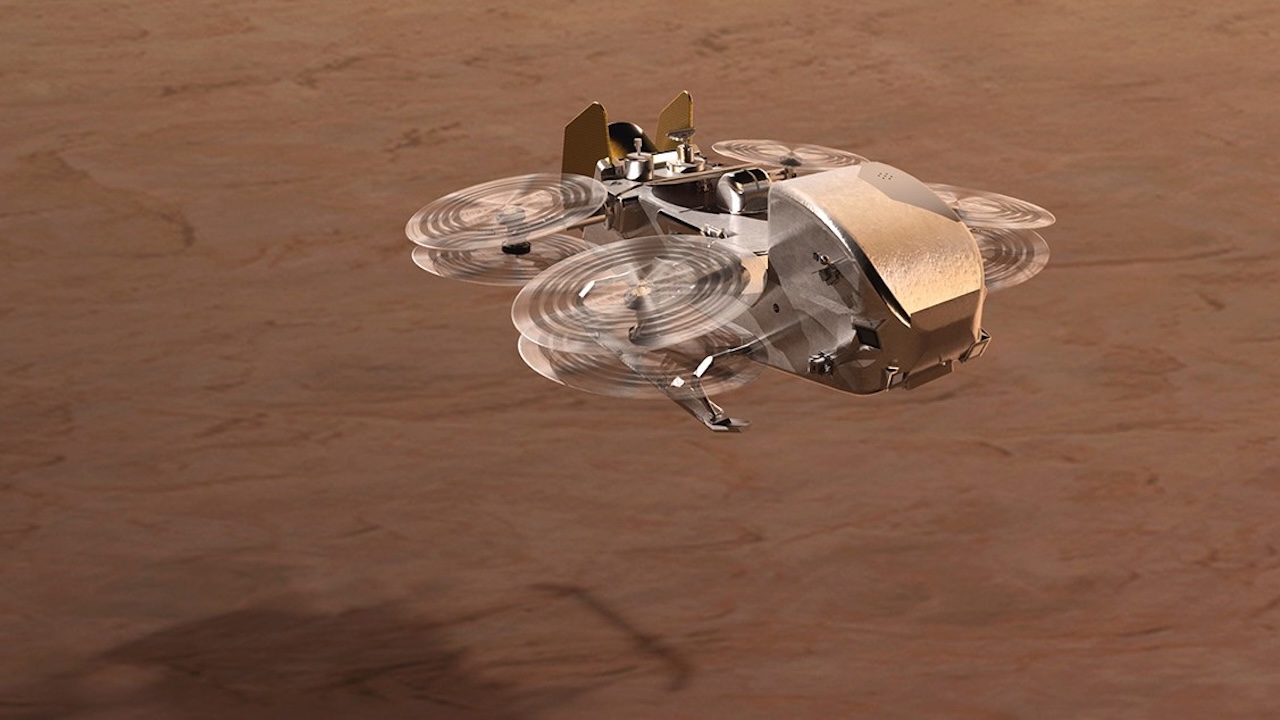
Artist’s impression of Dragonfly landing on Titan. Image: NASA/Johns Hopkins APL/Steve Gribben NASA’s Dragonfly mission will send a rotorcraft lander to the surface of Titan in the mid-2030s. Dragonfly’s science

Astrobiology Science Conference (AbSciCon) — Grok via Astrobiology.com The Astrobiology Science Conference (AbSciCon) is an international conference that brings together scientists, researchers, students, and other professionals to disseminate the results
Keith Cowing Biologist, Explorers Club Fellow, ex-NASA Space Biologist and Payload integrator, Editor of NASAWatch.com and Astrobiology.com, Lapsed climber, Explorer, Synaesthete, Former Challenger Center board member 🖖🏻 Follow on Twitter
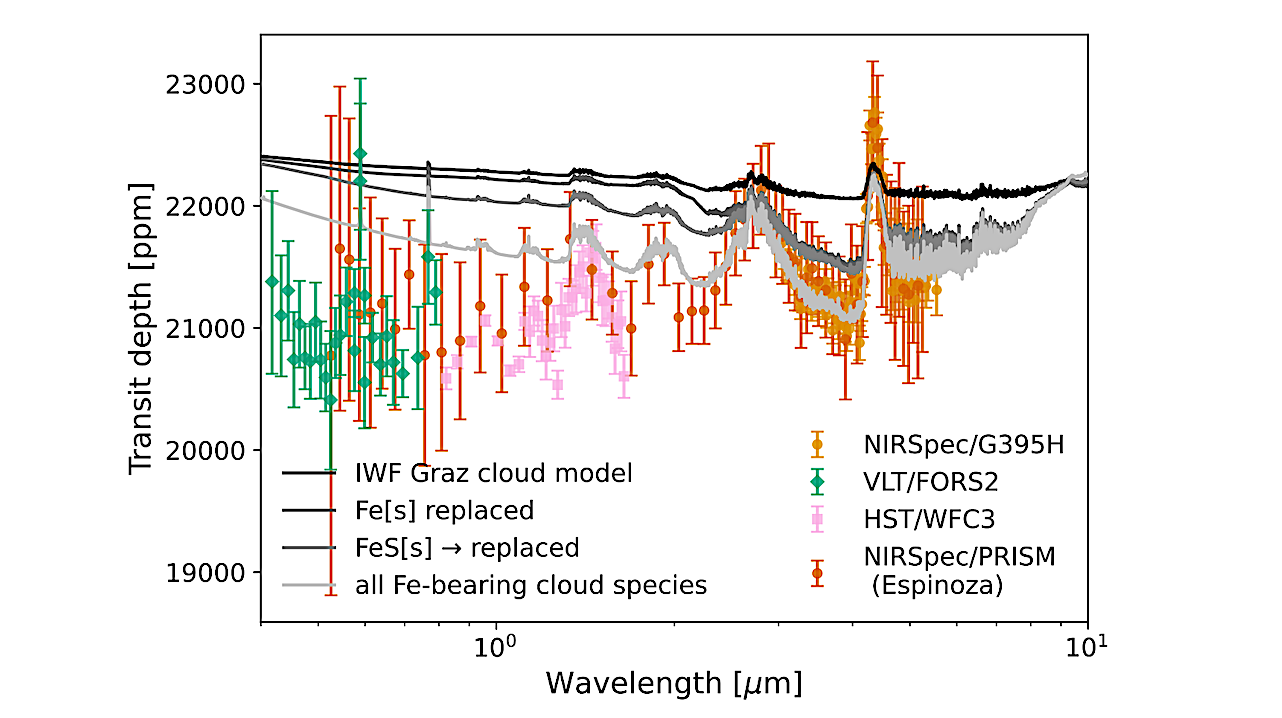
WASP-39b transmission spectra and cloud scenarios. Spectra are observed with JWST (orange), HST (magenta), and VLT (green) in comparison to models with different Fe content: full IWF Graz cloud model
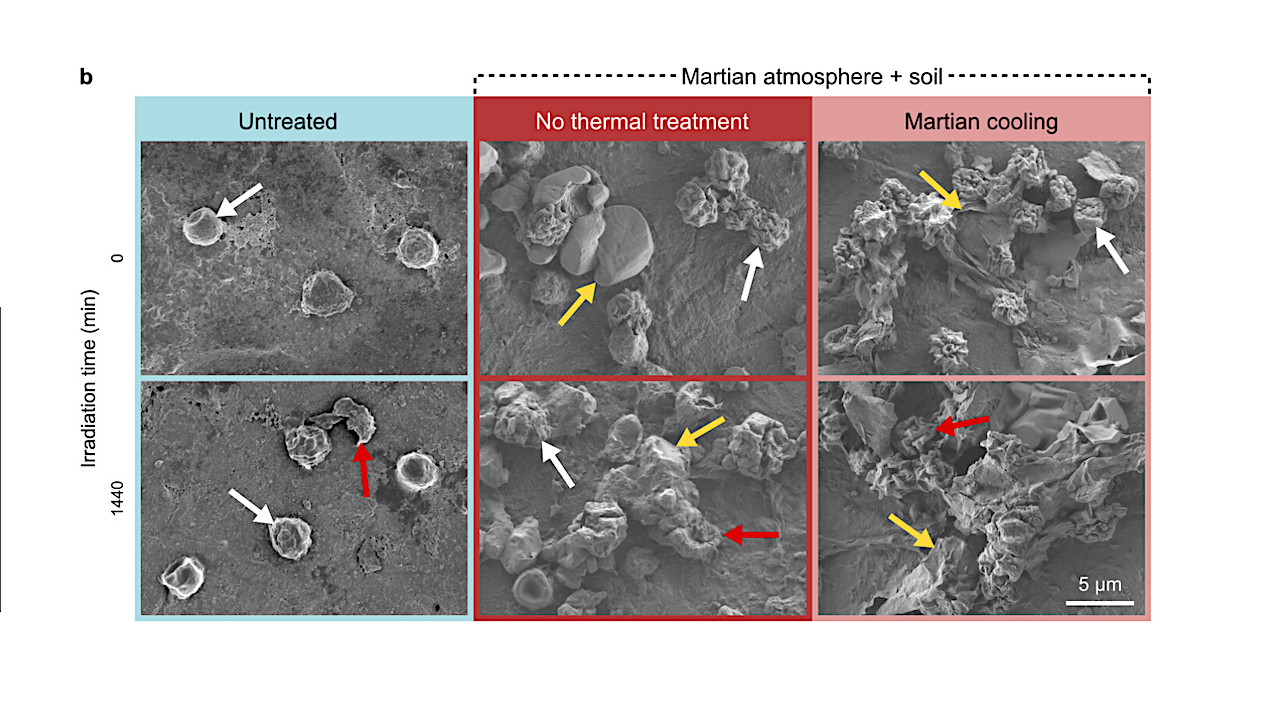
SEM images demonstrating the morphological changes of A. calidoustus conidia during exposure to SMC (irradiation, atmosphere, regolith, and cooling). White arrows indicate intact conidia, red arrows indicate lysed conidia, and
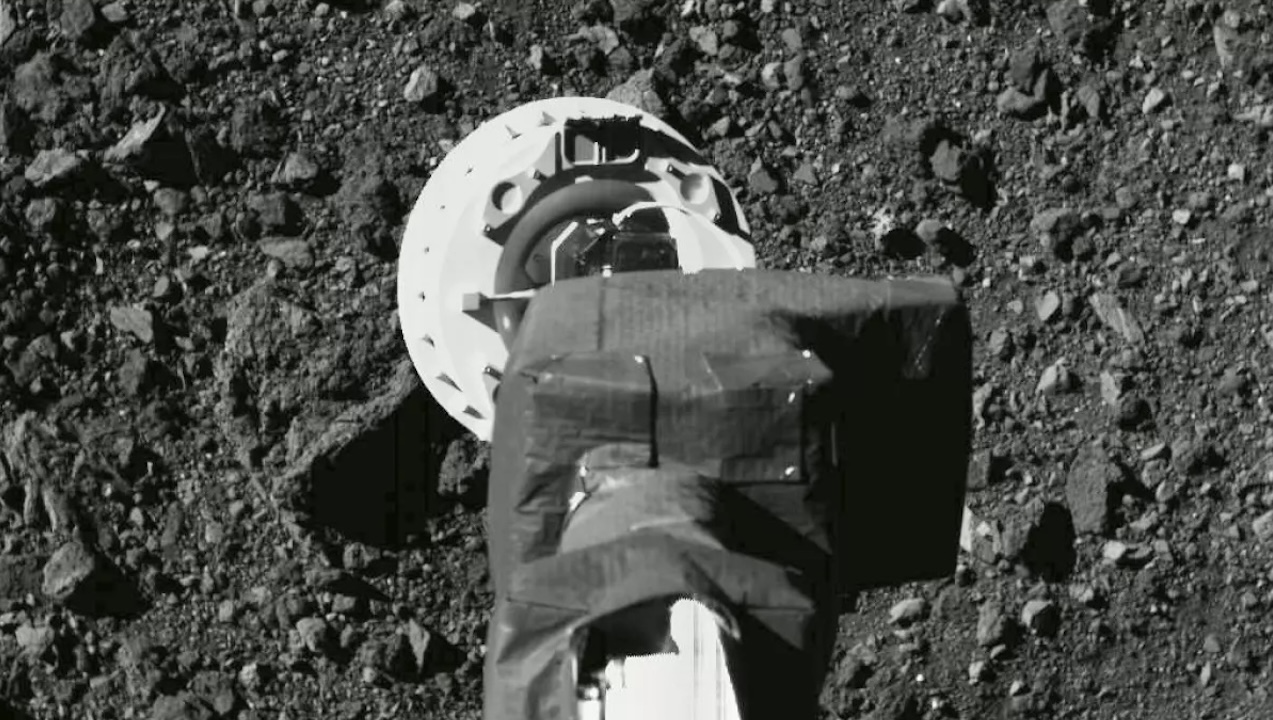
OSIRIS_Rex taking a sample of Asteroid Bennu — NASA To date, three samples from near-Earth asteroids have been delivered to Earth by Japan’s Hayabusa (2010) and Hayabusa2 (2020) missions, and
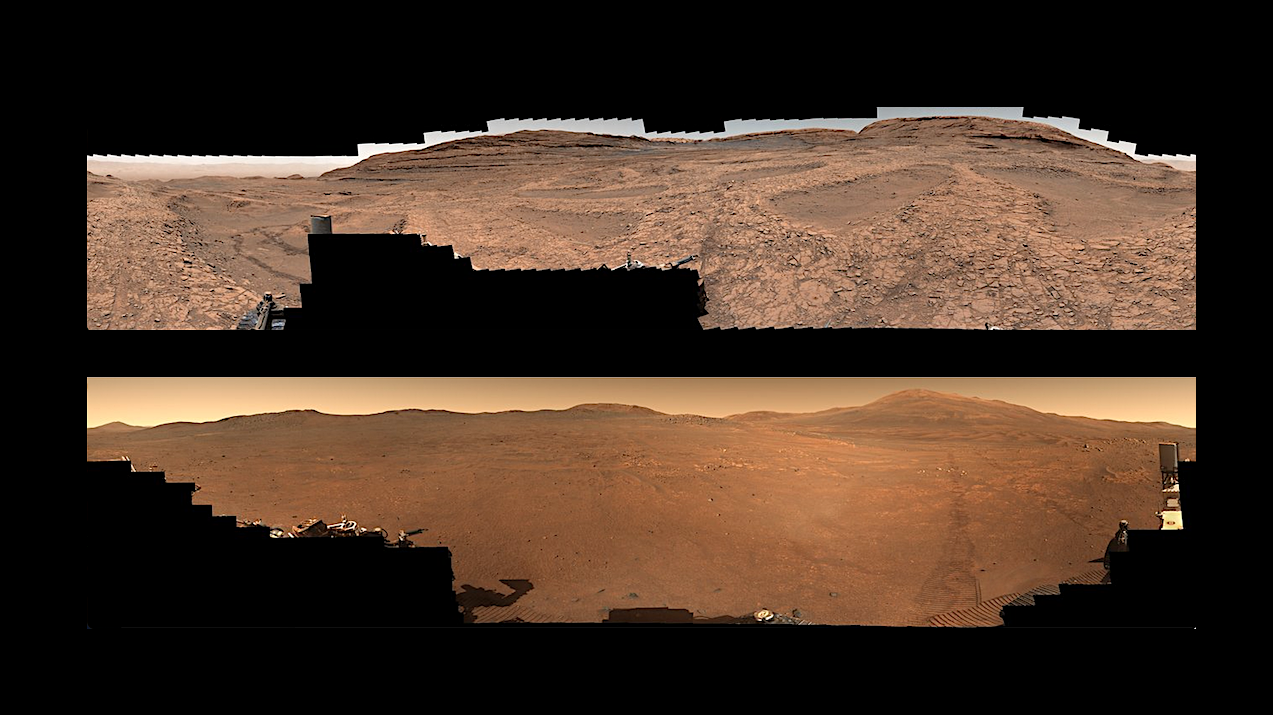
TOP – NASA’s Curiosity Mars rover captured this 360-degree view of a region filled with low ridges called boxwork formations between Nov. 9 and Dec. 7, 2025. At 1.5 billion